

Is FT8 growing at the cost of SSB Phone and CW?
Is the above assumption true? … Perhaps NOT! … Perhaps the majority of FT8 QSOs are done by radio amateurs who are relatively newer licensees, belong to the generation that is more social media savvy, and hence might be prone to regularly tweet or put up posts about their DX activity that they almost invariably conducted on FT8. Hence, being more vocal about their activities, they tend to project FT8 all over the media, thus giving a rather false impression that FT8 might have almost totally taken over HF amateur radio. However, this notion is far from the truth… In this article, we will do some statistical analysis of HF on-band activity using scientific methods. Based on these, we will attempt to draw realistic and logical conclusions.
Before I proceed with our step-by-step analysis, I would convey my gratitude to Michael Wells (G7VJR) for making a huge set of raw analytical data compiled from logbooks (ADIF files) of over 84000+ Club Log amateur radio members (DX operators) from around the world. The raw data provided by Mike takes into account the modulation modes used by these operators to have conducted an aggregate of over 731 million QSOs. Mike has graciously allowed open access to this data for further analysis.
Based on the above-cited database, Mike (G7VJR) has also presented a Club Log Graph to display the modulation mode trends over a period of a 15 year span. This graph presents information in terms of the percentage of modulation mode-wise activity. For general purposes, this is fine. However, for our specific purpose, it would be more meaningful if we plot these graphs all over again but with the data being processed differently. We would like our graph to display actual QSO volumes for different modes and not their percentage share. For our purpose, presenting percentage graphs tend to distort the answer to the question that we are trying to address… I will give you an example… Let’s say, a shop sells 100 pineapple pastries and 100 chocolate pastries every day. Hence, the percentage sale of the items is 50% each. Now, let us say, the shop begins to receive an additional order for the supply of 200 cupcakes every day. This alters the dynamics because, now, in percentage terms, the pineapple and chocolate pastry sales are no more equal to 50% of total sales. Their sales share in percentage terms reduces to 25% each… Does it mean that there might have been a decline in the sale of either of the pastries? … NO! … They are still selling at 100 pieces each, however, a quick glance at the percentage statistics might lead one to believe that their sales have declined to half… This is the kind of pitfall that we would like to avoid as we continue our discourse. Therefore, instead of percentage, we will go for the real numerical QSO volumes.
Raw log data analysis of FT8, SSB Phone, CW, etc…
Let us first plot the raw data that is available to us and see where we stand before we begin to refine our data processing protocol to eventually enable us to extract vital information from the terrible clutter that we have in the raw dataset. Nevertheless, the graphical plot of raw data also presents us with some very interesting and meaningful observations.
The database made available by Mike contains daily aggregate activity volumes segregated by modulation modes. The data for each day starting with January 2006 to January 2021 is available at my disposal. This amounts to 5475 data records with each containing daily aggregate QSO volumes broken into SSB Phone, CW, RTTY, PSK, FT8, FT4, and Others. Out of these 7 mode categories, I have chosen to eliminate the “Others” category from our computation and graphical renderings to avoid unnecessary graph clutter. The QSO volumes in this category are extremely small to noticeably influence the outcome of our analysis.
Therefore, our raw data plots as well as the subsequent refined final plot presents QSO volumes for 6 modes, excluding the “Others”. Take a look below for the Raw graph and the relevant observations pertaining to it.

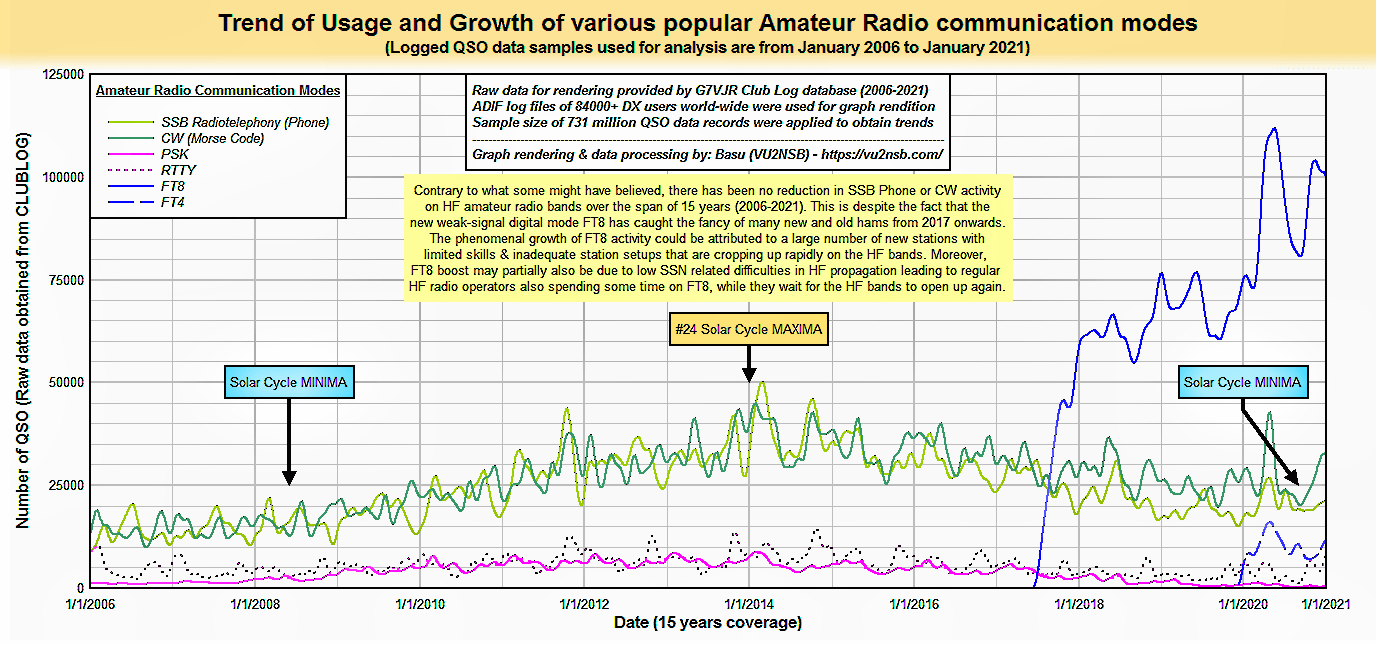
This graph set displays the raw data plot of various popular amateur radio communication modes. The quantum of QSOs for various modes are displayed. However, being a raw plot, the display is quite cluttered though it highlights the large QSO volumes during various contest events. The graph set represents data from January 2006 to January 2021.
As I stated earlier, the visual graphical rendering of the raw data was destined to be a mess. The overall clutter in the entire graph makes close observations of individual modulation modes almost impossible, thus finer inferences simply cannot be obtained.
However, there are a couple of interesting points that stand out... Firstly, the light and dark green colored spikes representing SSB Phone and CW respectively shoot up to exceptionally high magnitudes at fairly regular intervals. There are also repetitive dotted pink smaller spikes that represent RTTY activity. Secondly, the main daily activity on the days other than when the spikes appear are rather difficult to interpret in this graph but the FT8 mode represented by the blue-colored curve also happens to be in the lower region.
So, what are these massive spikes? How come we have such huge activities on specific days at regular annual intervals and not otherwise? ... Well! ... The answer is that the largest light and dark green spikes represent the days when the world's most popular amateur radio contests, the CQ WW (SSB) and the CQ WW (CW) contests fall. These happen to be once a year each during the last weekends of October and November respectively. Of course, there are other relatively smaller spikes too. They represent various other HF amateur radio band contests.
Wow! ... Who says that radio amateurs are no longer badly hooked into SSB radiotelephony and CW? ... Look at the huge QSO volumes. Mind you, these volumes as seen on the graph come from the logbooks of only 84000+ operators that we have access to. The real total QSO volumes are several orders of magnitude higher.
The highest CQ DX (CW) contest QSO volume of 1,363,811 (1.36 million) and the highest CQ DX (SSB) volume of 1,289,759 (1.29 million) as obtained from our database records occurred in the year 2014. Please note that the year 2014 witnessed the peak of Solar Cycle #24. This explains the very high number of QSOs. During the low ends of the Solar cycle, though the contest QSO volumes for SSB Phone and CW were lower than the 2014 numbers, yet they were reasonably good.
A very important observation to make at this point pertains to the relevance and popularity of CW... Amazingly, and contrary to various popular beliefs, you could notice a huge increase in participation in the CW segment of CQ DX contests in recent years. This is despite the fact that over the last few years, as we pass through the rock-bottom at the cusp of Solar Cycles #24 and #25, the signals are expected to be far weaker. We also witness a huge impact of FT8 with many operators using it day-in and day-out. Under these circumstances, one might have expected that CW and also perhaps SSB Phone to have taken a beating. Yet, all the years from 2017 to 2020 show huge CQ DX (CW) participation. The peak volume in 2014 (at SSN peak) was 1.36 million, while the corresponding volume in 2019 (at low SSN) is still as high as 1.03 million. This is a good sign because, with the future improvement in SSN, both CW and SSB Phone activity is bound to go up. On the other hand, the FT8 QSO volumes have never exceeded a dismal volume of 158,676 per day to date.
The Final analysis - Is FT8 eating into SSB Phone and CW QSO volumes?
The short answer is NO! ... The introduction of FT8 apparently has practically no noticeable impact on the regular average amateur radio QSO volumes on HF band SSB Phone or CW. The bulk of the FT8 activity seems to be originating from and conducted between those licensed operators (both new and old), who before the advent of FT8 might have been off-air due to lack of adequate HF radio station infrastructure at their disposal. Now, they seem to have eventually stumbled upon an unexpected opportunity with the induction of FT8. This is despite the fact that FT8 is technically speaking, merely a border-line mode that barely qualifies as a communication mode in the true sense of the term's definition. It is also highly restrictive in nature, however, on the plus side, it has opened up avenues for non-optimal and inefficient radio stations to finally establish radio contacts which they couldn't earlier do using the regular modes. Hence, perhaps a whole new set of previously dormant amateur radio licensees and newbies with limited skills have now managed to take a plunge into the world of HF radio. This might be the reason we see a surge in FT8 QSO volumes without adversely affecting SSB Phone and CW QSO.
Let me now present another set of refined graphs that are also derived from the same raw data that we processed and presented above. In this new presentation, I have processed the raw QSO data through a comprehensive set of sophisticated data processing algorithms to extract a truly meaningful visual presentation in a graphical form. We have removed the contest-related abnormally high QSO volumes for those specific days, thereafter, I also applied a set of complex mathematical filters for smoothing the curves to produce the graph set shown below.
Graphical plots depicting the trend of usage of various HF amateur radio modulation modes with a comparative assessment of traffic volumes and associated growth trends. The data is derived from logbooks of 84000+ ham radio DX operators world over. Total of more than 731 million QSO log entries have been parsed and processed to create the graphs...
Click the above image for a larger view.
As in the case of the previous graph set, this new graph also displays the QSO volumes for the 6 modes - SSB Phone, CW, RTTY, PSK, FT8, and FT4. The color-code legends along with the date-periods of Solar Cycle (SSN) maxima and minima have also been marked to enable readers to observe the logical trends of QSO volumes.
As expected, all the traditional modulation-mode (SSB, CW, RTTY, PSK) QSO volumes peak and dip in consonance with the waxing and waning of Solar Cycle activity. At the peak of the Solar Cycle, it is natural to find more activity while they reduce during the SSN minima. This is a natural pattern that has been going on over a century and over various previous Solar Cycles in the past.
However, this time around, during the end-part of the Solar Cycle #24, from 2017 onward, we have a new player added to the repertoire of popular HF radio modulation modes. This is the FT8 mode along with the lesser-used FT4 and a few other variants of the WSJT family. As I mentioned earlier, a lot of FT8 type activity has been occurring since then.
Has the induction and sudden rapid growth of FT8 made an impact on the traditional modes like SSB Phone, CW, etc.? Have amateur radio operators in general migrated to the simple and easy FT8 and consequently started abandoning SSB or CW? ... The answer, according to our scientific, rational, and unbiased data analysis is an emphatic NO! ... Surely, there has been additional traffic on account of FT8 but certainly not at the cost of regular modes. Not only that there has been no decline but more importantly there has been no stagnation. The traditional SSB Phone and CW activities continue to grow at a regular and normal pace.
Look again carefully at the above graph set. Prior to 2017, there was no FT8. The peak SSB and CW QSO volumes before 2017 were traditional activity volumes. The 2012 to 2016 period (with an SSN peak in 2014) saw QSO volumes that may be considered as reference. The period around SSN minimas of 2008 and 2020 respectively witnessed a traffic reduction from the 2014 peak reference point... This is quite understandable...
However, what is truly fascinating is the fact that despite the newly acquired craze among many operators for FT8 after 2017, the CW and SSB Phone QSO volumes have grown during the current SSN minima phase compared to the earlier 2008 minima period... We observe is that compared to the previous solar Cycle minima of 2008, the QSO volumes during the latest 2020 minima period have actually increased. Not only have SSB volumes increased but the CW volumes have increased far more. The CW volumes are averaging around 25000 QSO per day now compared to around 15000 QSO during the 2006-2008 period. This is an increase of more than 65% despite the presence of the extensively used FT8 mode.
It appears that although FT8 and other WSJT modes are going strong, the essential life-blood of amateur radio still continues to be the SSB radiotelephony and CW which are doing absolutely fine. There is a healthy and sustained growth of these core radio communication modes on the amateur radio HF bands. FT8 attracts high volumes undoubtedly, however, it doesn't seem to adversely affect either SSB Phone or CW modes of radio communication.
Conclusions and closing Comments
- Let us acknowledge that FT8 produces considerable QSO volumes which currently during the low SSN period certainly accounts for more QSOs than SSB Phone or CW.
- However, the FT8 QSO volumes have apparently made no impact on regular SSB Phone or CW QSO volumes. These regular modes continue to grow at a healthy pace.
- Contrary to popular belief that CW might be a dying mode, the fact is that CW QSO volumes have shown signs of exceptional growth. This is despite the fact that in many countries, proficiency in CW is no more mandatory for acquiring an amateur radio license.
- During major SSB Phone as well as CW contests, when a lot of hams take a timeout to participate, the QSO volumes often exceed 1 million QSO for each mode in a single day. The FT8 traffic volumes are completely obliterated on these days. The maximum ever recorded FT8 QSO was just around 159 thousand QSO on one particular day.
- At this stage, some readers might wonder, why is it that we read so much about FT8 activities on various media platforms and so little about the regular modes? ... The answer might lie in the fact that most of the newer ham licensees are social media savvy. Many of them share almost everything they do in life. They nearly live on social media and several of them are masters of over-sharing. A large number of ham radio contacts they make end up with a tweet or a set of posts on several major social media platforms. Most of these contacts happen to be on FT8. On the other hand, old-timers rarely get overly excited about regular DX contacts. They rarely put them out in the world with an intent to seek applause from the audience.
- Disclaimer:- The traffic volumes of QSOs for various modes have been derived from the submitted logbooks of 84000+ operators. These include over 731 million recorded log entries. In statistical terms, this is quite a healthy and robust sample size considering the size of the total number of active radio amateur population around the world. Given the large sample size of the analyzed data, we do not expect a deviation of more than ± a few percentage points from the real trends. The absolute quantum of QSO for each mode depicted in our graphs might be far lower than the global aggregate values due to the limited data-source sample size at our disposal. However, our data-set sample size is large enough to project fairly accurate relative proportional trends of QSO volumes for every mode. Hence, this analysis, although not perfect, could be considered to be a reasonably accurate trend indicator.


(15 votes, Rating: 5.00) - Please vote the article with your valuable star rating. Thanks! Basu (VU2NSB)
SSN SSNf(10.7) – Real-time Solar Data


