S-meter Noise Floor in HF Radio Receivers
Through a set of several articles, I have tried to place on the table various pitfalls of working HF DX under these conditions as well as offered various solutions to progressively enhance the amateur radio station’s capabilities to mitigate the effects of adverse conditions that often limit our DX capabilities. Most of the solutions that I have provided do not need a big capital outlay. All you need is a couple of tweaks to your ham shack, your antenna, and most importantly your transmission line. Search and read those articles on this website if you need to optimize your station… In this article too, I intend to stress on another noise floor related pitfall that might lead to various misinterpretations.
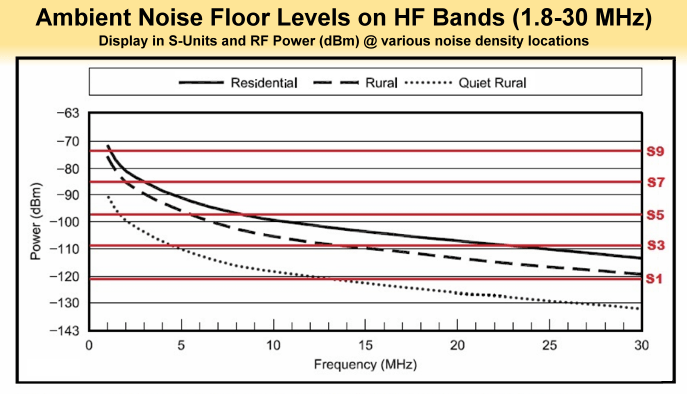
This is a quick reference chart depicting typical Noise Floor levels that prevail across the HF spectrum which in turn adversely affects terrestrial HF radio communication.
In that case, either you are really good and surely have a well-optimized radio setup, or else, you might only be working FT8 or some other similar mode, while considering FT8 DX to be some sort of remarkable achievement. Unfortunately, such a notion happens to be rather delusional. Forgive me for being so blunt (some might even say abrasive) but if you fall into this latter class of radio amateurs, you might be suffering from an acute lack of understanding on the subject of HF radio communication and propagation. You perhaps have a lot to learn… On the other hand, those who are good and knowledgeable, already have optimized radio station setups to negotiate hostile propagation conditions. Therefore, they know how to, when to, and where to find propagation openings on HF bands and leverage it to their advantage. Thereafter, using their skills and their optimized radio stations, they manage to achieve reasonable success in working DX on either CW or SSB radiotelephony or both…
Whereas, those who work HF radio DX most of the time by falling back on the crutches of highly specialized but equally mundane and restrictive weak-signal modes of the WSJT family like the FT8, etc., perhaps need to ponder about how little, if anything, they might have achieved. What is most appalling is that some of these operators even run QRO at several hundred watts while working FT8. Then they go on to justify themselves. They argue that FT8 is officially described as a Weak-signal mode but not a Low-Power mode. So, what’s wrong if I run 600W or even a kilowatt? … To people with such lame arguments, I would say, they perhaps might have already achieved the ultimate, fulfilled their objectives, and attained Nirvana. There might be nothing more for them to achieve in the world of amateur radio… I humbly retreat and rest my case.
However, there are others like you and me, who wish to continue to explore better prospects and possibilities of working more-and-more substantive and meaningful DX on HF bands. We like to use true radio communication modes like either CW or SSB radiotelephony or any other real-time conversational digital text modes. Hence, let us attain a clear understanding of various limiting factors that confront us and work on tweaking our radio station setups in whatever way needed to optimize performance… As a start, before continuing, one might like to read these articles to perhaps attain a clearer insight into some of the concepts… 100W on a Wire Antenna – How far would it reach?, and also read How badly can high Local Ambient QRM affect HF Radio?. You might also like to skim through Does Coaxial Cable Choke at Antenna cut RF Noise?, and also perhaps Radio Transceiver S-Meter – Pitfalls to avoid.
What are the acceptable noise floor levels on HF bands?
Radio-frequency spectrum noise is one of the major limiting factors in radio communication. This is an aggregate of the natural noise (QRN) and the man-made noise (QRM). When we speak of QRM in this article, we do not refer to noise on account of band congestions leading to overlapping transmissions from other interfering stations. Such QRM can usually be negotiated by careful selection of operating frequency and applying directional antennas, various filters, and other transceiver features… What we are considering here is the QRM produced by the aggregation of various broadband electrical noise sources at your QTH, your neighborhood, and also to a certain extent due to the noise aggregation of thousands of electrical noise sources within your city.
The natural noise level (QRN) will vary with the frequency band and the time of the day. It will certainly be there as an integral part of any HF radio communication scenario. However, the magnitude and effects of man-made noise (QRM) are controllable to a certain extent. This is what we intend to target to mitigate the overall noise levels.
Typical noise levels due to local QRM varies in magnitude depending on the type of human settlement. More congested places like the urban areas would usually generate a higher magnitude of aggregate QRM due to the higher density of electrical machines and modern lighting fixtures in comparison to suburban and rural areas. Therefore, those of us who live in cities and large metropolitan areas are subjected to higher QRM levels compared to those living in villages.
The magnitude of noise also varies with frequency. The lower HF radio frequency bands are more adversely affected. The higher frequency bands progressively experience lower noise levels. The 10m HF band is the least noisy, whereas the 160m and 80m bands are the noisiest. Further up, the VHF/UHF bands are subject to the very marginal influence of both QRN and QRM.
Let us examine the estimated aggregate noise power density of combined QRN and QRM on various HF radio bands as might be experienced at different types of locations. I will tabulate the quantities below and present the noise levels in both dBW @ 1Hz BW (dBW.Hz) and the more familiar S-Units @ 2500Hz BW. This should provide you with a reference of noise levels to expect. If the static noise level on any band shows up much higher on your transceiver’s S-Meter, then there should be a cause for concern because it would indicate a non-optimized and under-performing radio station setup.
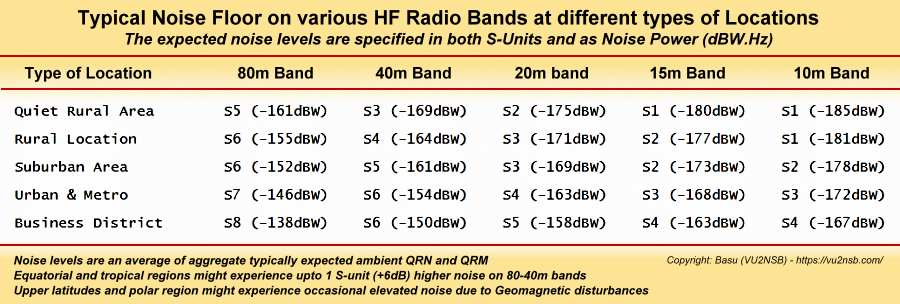
The table depicts an average of typical measured noise floor levels on various amateur HF radio bands. These noise levels are measured at various types of locations that include Rural, suburban, Urban, etc. The indicated noise floor levels are the sum total of static QRN and QRM.
The above table displays the aggregate static noise levels to be expected on the HF bands at different types of QRM classified locations. The business or industrial districts would have the noisiest ambient environment on account of a high density of electrical machinery and equipment. This is followed by Metro/Urban areas, Suburbs, rural, and so forth. As a consequence, the rural and suburban areas are far quieter than urban areas from the RF noise perspective. The noise level data cited in the table above are more or less universal across the globe.
However, the equatorial and tropical regions at low latitudes might typically have about 1 S-unit higher noise levels on the 40m band and below. Hence, the 80m and 40m bands might be noisier during the night at radio stations located near the equatorial regions. Similarly, during the conditions of major Geomagnetic storms and disturbances, the upper latitudes, especially the polar region might experience elevated noise levels. Short-term atmospheric, as well as ionospheric disturbances, may also temporarily elevate the HF band noise levels. For instance, during lightning and thunderstorm events, the noise levels might be rather disturbing, especially on the lower frequency bands... Keeping in mind the above caveats, the information given in the above table is fairly reliable and correct.
Those of us who might experience substantially higher noise floor levels than what I cited above perhaps need to go back to the drawing board and thoroughly review their equipment setup with special emphasis on the antenna and the transmission line... Many people often report S9 or S9+10 or even higher noise floor levels on 40m and 80m bands. Some people might have S7-S8 or higher noise levels on the 20m band. These are quite unhealthy and be unacceptable. In such instances, one ought to make efforts to reduce the noise into the receiver to be able to make decent use of the HF radio bands.
OK! ... So, if my noise levels on various bands meet the criteria given in the above table, am I good to go? ... Not yet! ... OMG! ... Now what? ... Well, the problem is that the noise floor based S-meter deflections that you see on your transceiver (TXR) are most probably incorrect. Therefore, we must correlate the erroneous TXR S-meter readings to what should be the more accurate equivalents. Thereafter, we need to ensure that the duly corrected S-meter equivalent values meet the noise criteria cited according to the above table... If that happens, then only we would be truly good to go.
There is a separate article on this website that explains typical S-meter issues and anomalies that are very common in most amateur radio transceivers, irrespective of the manufacturer or the model of the rig. Inaccuracies of S-meters is one of the most common yet the least spoken about malaise in most transceivers with AGC-derived S-meter systems. Please read my article titled Radio Transceiver S-Meter – Pitfalls to avoid for more information. Continue reading the next section below to understand the full concepts.
At this stage, if some people are still skeptical about the profound importance of reducing the HF noise floor at the receiver, before continuing, please read this article How badly can high Local Ambient QRM affect HF Radio? to get a detailed graphical perspective into how the static ambient noise plays havoc on radio communication.
True Interpretation of HF band Noise Floor as seen on S-Meter
In the previous section of this article, after determining the expected noise floor levels on various HF radio bands at different places, now, we need to interpret the S-meter deflection as obtained due to the noise floor on most radio transceivers. We need to apply a correction factor to account for the S-meter reading errors. Unfortunately, this correction factor is not uniform across various brands and models of radio transceivers. Therefore, I will present a chart below from one of my earlier articles on Radio Transceiver S-Meter that I cited in the previous section. This chart is based on measurement conducted on transceivers of various makes and models. By using the following chart, we may translate the erroneous S-meter reading to what it should have been if the S-meters were not so wonky. Thereafter, we may apply the corrected S-meter noise floor values to to the earlier cited noise floor table to find out where we really stand... Although not all transceivers are listed in the S-meter error table below, it is pretty easy to get a realistic idea for any other make or model with similar features and price tag.
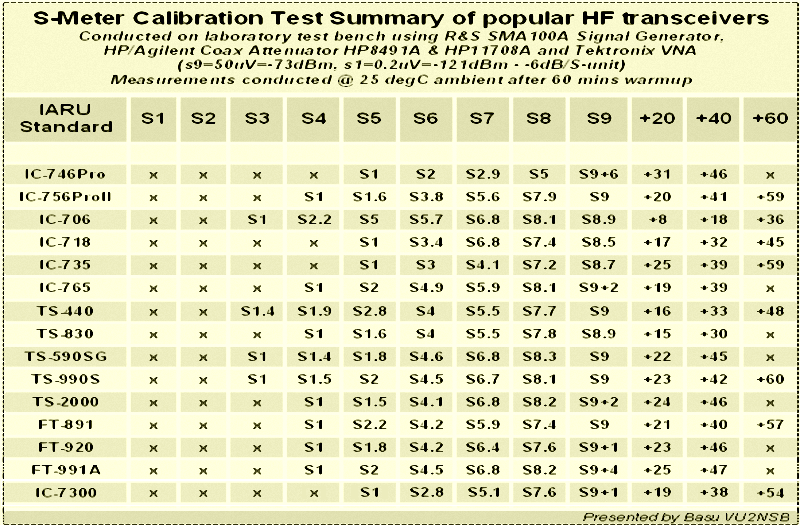
The result of the S-Meter calibration accuracy test performed on randomly sampled popular amateur radio transceivers of various makes and models. almost all rigs have shown quite an excessive deviation from expected results.
Barring some new but rather expensive transceivers that are based on full SDR implementation with RF DSP, all other rigs generally rely on a hybrid or analog RF and IF system that is controlled by an AGC feedback loop. The gain control characteristics of such feedback mechanisms depend substantially on the non-linearity of the active electronic device transfer characteristics. As a consequence, the negative feedback error control voltage, which is the AGC voltage, also follows a non-linear relationship w.r.t the input signal level. The S-meter voltage is a direct derivative of the AGC correction voltage. Hence, the AGC and consequently the S-meter does not follow a simple well-defined linear or logarithmic relationship to the input signal level. Although a portion of the S-meter scale close to the S9 level on either side is reasonably well-calibrated to the desired values, however, as we deviate further away from the S9 point, the deviation error in the S-meter reading accuracy begins to grow quite rapidly.
Not that the S-meter calibration couldn't have been made substantially better but cost-cutting by rig manufacturers results in simplified AGC-derived S-meter circuits leading to pretty pathetic S-meter implementations. The use of analog computation methods for processing using a set of operational amplifiers could provide better curve fitting to achieve improvements. Similarly, a lookup-table-based point-to-point curve correction could have also been another alternative, or analog multiplier circuits for gain control could have also yielded better S-meter response... However, the transceiver manufacturers couldn't care less because such efforts do not usually fetch more revenue.
Therefore, most of the radio transceivers would appear to be well-calibrated near the S9 level, the S-meter calibration below S6 levels usually begins to fall apart. The S3-S5 level readings and below are absolutely atrocious in most cases.
Please also remember that most manufacturers have the S9 point of the S-meter calibrated with both the preamplifier and attenuator switched off. Please make sure that you do NOT switch on either of these when trying to access the S-meter noise floor readings for further correlating and error correcting using the S-meter error table above. You must also ensure that the RF Gain control if any must be kept at maximum gain. The Noise Reduction (NR) in modern DSP based rigs and/or Audio Equalizers must be disengaged while conducting this exercise.
Now, let us move on and check out an example to highlight the typical nature of the problem that we face while interpreting noise floor levels from S-meter readings...
Assume that someone lives in an urban area. The projected noise level for the 20m band is around S4 according to the Noise Floor table that I presented earlier. Let us say that you also find that your rig's S-meter also shows S4... Does it mean that everything is hunky-dory? ... No, unfortunately, it might not be so. Refer to the S-meter calibration accuracy chart above. You will find that for almost every transceiver listed there, the miscalibration of the S-meter at around the S4 deflection region is such that the real reading should have been around S6. In other words, if you see an S4 static noise floor level on your S-meter, in reality, the noise level is at least +2 S-units (12 dB) more.
Whereas, if the aggregate ambient noise level at your radio station were to be truly S4 then the S-meter reading on most transceivers would be showing S1-S2... Therefore, we need to understand and duly recognize the colossal shortcomings of our transceiver S-meter. The high degree of miscalibration that these meters usually have, lead to a false sense of euphoria. These meter scales (as well as the fancy waterfall displays) grossly misreport noise levels (as well as signal levels). Typically, they show a far lower noise level than what truly exists. An amateur radio operator might tend to get a feeling of a false sense of well-being about his radio station setup, whereas, the truth is that it might be far noisier than what should be acceptable...
Finally, a word of caution... Many of us who possess modern transceivers like IC-7300, FT-991A, etc., might be sitting back and happily smiling away thinking that these S-meter errors are not for us. After all, our rigs are great. Therefore, all these discussions do not apply to us. Isn't it? ... NO, it isn't so... From the perspective of the issues that we discussed in this article, these rigs are also pretty pathetic. Check out the S-meter calibration chart above carefully for the IC-7300 or the FT-991A. You might be disappointed to discover that these rigs do not even match up with some of the older rigs like the IC-706 family, TS-440, etc., which had far better S-meter systems.. Of the new line of rigs, the Kenwood TS-590SG is an unexpected notable exception.
No wonder, the ICOM IC-7300, and Yaesu FT-991A tend to report far lower noise levels than other transceivers. Operators tend to think that the lower noise is due to the use of modern technology that other transceivers perhaps do not have... However, as we have seen, that's not entirely true. The poorly calibrated and dishonest S-meters of the rigs are largely responsible for hiding the truth. If you really want to understand what the noise floor levels should be on a truly well-calibrated S-meter, one way of doing it is to check out any of the newer Flex radios. You will discover the truth.


(20 votes, Rating: 5.00) - Please vote the article with your valuable star rating. Thanks! Basu (VU2NSB)
SSN SSNf(10.7) – Real-time Solar Data